Phase Transitions and Coexistence in Nanoclusters of KCl |
Phase Transitions and Coexistence in Nanoclusters of KCl |
|
Phase Transitions These simulations were conducted
by the control of temperature (see the
Introduction on the procedure meaning and expected phase
diagrams profiles). It is noteworthy that the number of ions is not "magic". Indeed, KCl crystallizes in a faced-centred cubic (f.c.c.) lattice. So, considering the translation of the unit cell, with two ions (K+ and Cl-), through the three-dimensional space, one should find the right number of ions from (2xn)3, where n is the number of unit cells per dimension. The figures below show the evolution of the configurational and total energy, and other properties, as functions of temperature, for the clusters with 64 and 512 ions. The table guides the reader to computer animations for different cluster sizes and processes. Details of the simulations are described in: Phase Transitions in Ionic Clusters, F.Fernandes; L.Neves, American Institute of Physics Conference Proceedings (F. Bernardi, J.L. Rivail, Eds), 330 (1995) 313-318. |
Nanocluster with 64 ions
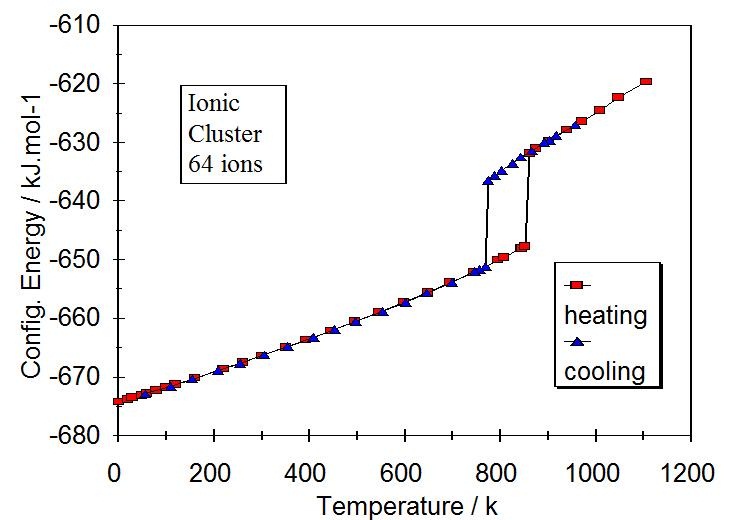
Figure 1. Melting and freezing by slow heating and cooling
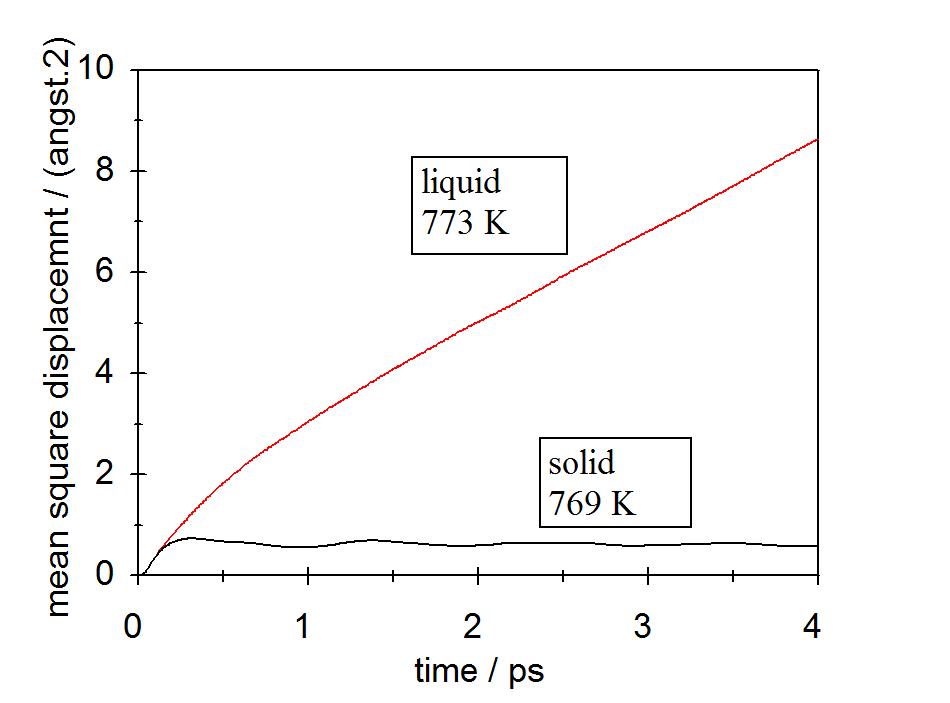
Figure 4. m.s.d. before and after freezing |
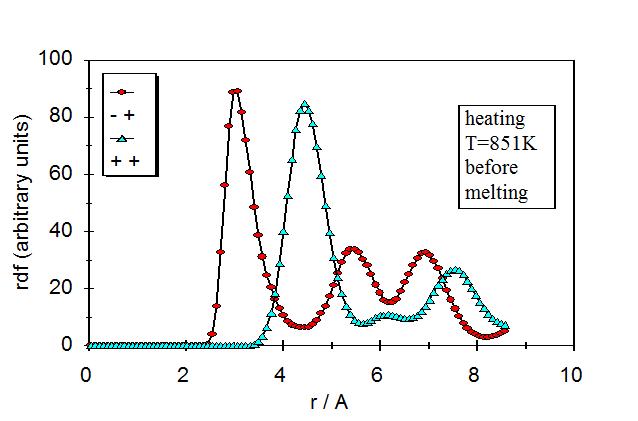
Figure 2. r.d.f. before melting
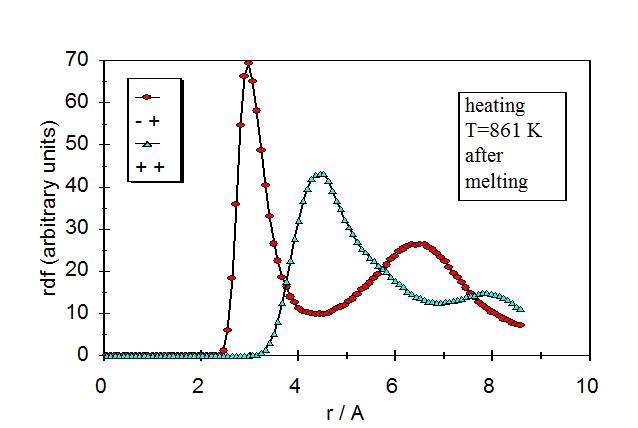
Figure 3. r.d.f. after melting
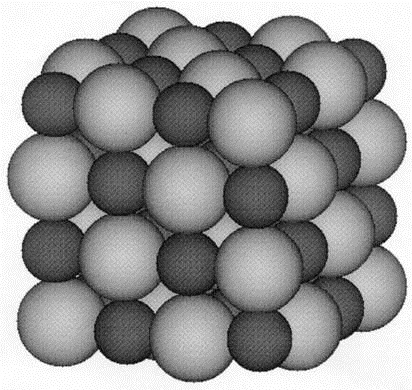
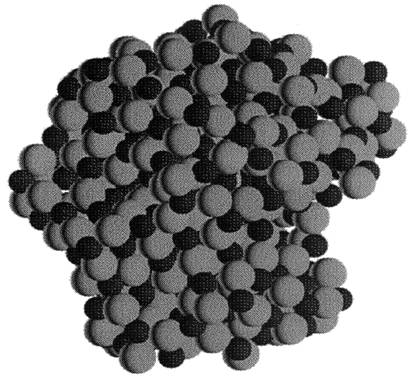
Figure 5. Snapshot at the freezing line end (~2K) |
Nanocluster with 512 ions
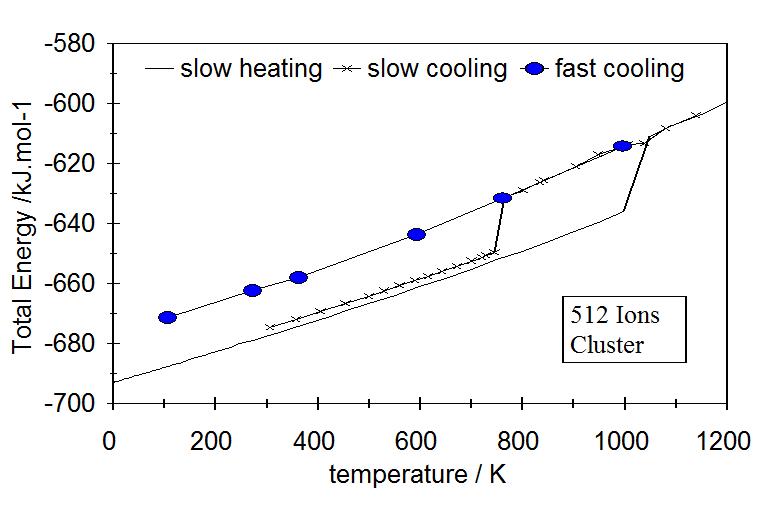
Figure 6. Melting and freezing by slow heating and cooling, |
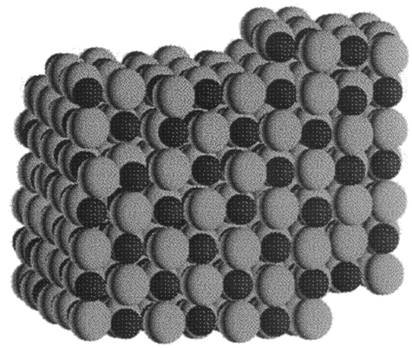
Crystal at ~100 K, after slow cooling from the liquid
Glass at ~100 K, after fast cooling from the liquid |
Table of Films
|